In the last couple of months, I’ve been working on a method for getting a nice visual characterization of a microphone’s directional frequency and phase response. It is an alternative method to the traditional directional characteristics diagrams. So, I’ve tried to collect a few of the results in this blog post. The visualization is highly useful in the process of modifying the microphone head by a horn or other acoustic pressure equalizer, in order to find the optimum settings for various recording situations; nature recordings, music and high frequency recordings. Those modifications are quite tricky, apparently tiny changes in the geometry leads to dramatic differences in the frequency response. The effect is very distinct on the on-axis as well as the spatial pick up pattern, especially in the high frequency range.
A few initial results: (full results are found in Pressure equalizer geometries and directionality)
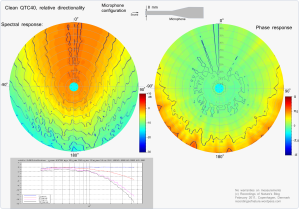
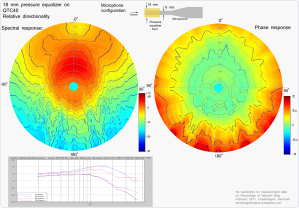
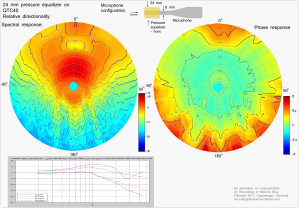
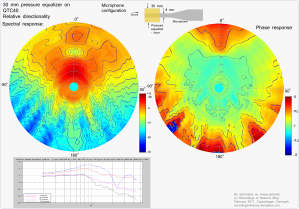
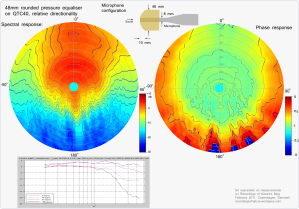
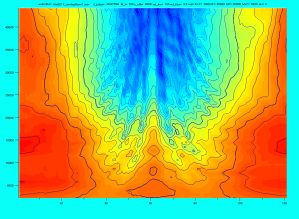
The figures show examples of the relative directional response of a Earthworks QTC1/QTC40 microphone without any modifications and one with various sizes of simple pressure equalizers fitted. In the polar plot, the direction from the center and out represents the angle of the incoming sound. On-axis response corresponds to 0 degrees (up), and 180 degrees is from the center and down. The lowest frequencies (from 2000Hz) start from the center, increasing linearly to the highest (45000Hz) at the outer rim. The color and contour lines represents the amplitude, red is high and blue is low. Each contour line is 2 dB.
The directional pattern shows the relative changes to a clean on-axis reference response. The center axis is normalized to the clean microphone on-axis response, which according to the calibration chart is within +/- 0.5 dB for the QTC40 microphone.
Correspondingly for the phase, each contour line corresponds to pi/4. The phase plot is not fully convincing at the moment, only showing deviations from linear phase change…
It is often said an omnidirectional microphone is newer not fully omni, hence will have a certain stronger pick up from the front. The following measurements illustrates this issue and the influence of the diameter of the microphone.
Uncountable geometries for the microphone horn/pressure equalizer can be imagined. Using a film roll, or a bundle of matches or similar as shown in the figure above, allows you to shape the horn very freely. Below is the measurement of a rounded geometry, somehow comparable to acoustic pressure balls from e.g. DPA
Ideally, I would like to find a geometry which adds just the right amount of directionality and bite, for giving nature recordings or musical recordings something special. When using a very omni directional microphone, something is missing. It is too clean. Playing with a few reflections, like what is happening in our ears might do the trick.
I will save most of the interpretations of the results for the next blog post, where a more systematic survey of different geometries will be presented.
For now, Id like to go more into explaining how the measurements were obtained.
The test method
The physical part of the setup consists of a microphone placed appx 80cm in front of a fairly standard speaker capable of producing sound in the range of 1000-45000kHz (KEF Coda 7). The microphone must be on a stand, which can rotate 360 degrees, while keeping the microphone end exactly in the same center axis position. During measurements of the phase changes, even 5 mm displacement will have a major influence for frequencies above 30 kHz. The rotation is carried out manually, in a speed of one revolution in 60 seconds.
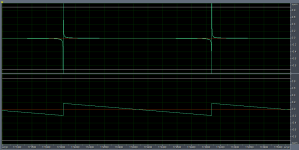
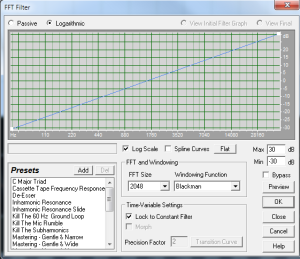
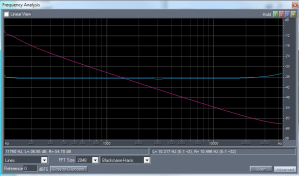
For the measurements a special sound sequence is produces, primarily containing a 15 + 60 seconds unit sample pulse train with a well defined period length. Running at 96kHz allows frequencies up to 48 kHz for the analysis, as long as the microphone, speaker and the rest of the sound equipment can handle it. The audio sequence is produced by taking a saw waveform tone with a period of 2048 samples, corresponding to 46.875 Hz samples @ Fs=96 kHz. To achieve pulses with a high content of high frequencies, standard saw shape is filtered gradual high pass filter, approaching a flat frequency content from 1000 to 45000 Hz.
Corresponding filter:
Spectrum of unfiltered and filtered saw waveform and pulse train
As the distance between each pulse in the pulse train is 2048 samples, it appears that the pulse have plenty of time to fully relax between each pulse. Eventual echos from the room may be causing some minor noise. This is good to know that each pulse can be regarded as fully independent from the rest of the pulses. But no room modes will be exitated from the pulse train.
Post processing
The recorded data is processed in Scilab (free Matlab alternative). Since all the pulses are synchronized with a precise spacing interval, it is easy to jump to exactly the pulses of interest and even phase differences can be measured. The algorithm is based on taking the FFT the individual pulses representing the different directions. First a reference response of the clean microphone, on axis, is obtained. Then it obtains the responses for all the directions during the rotation. By taking the difference between the reference signal and those from the rotation the effect of the horn and the direction in a given angle is calculated.
The FFT length on each pulse should only be very short, 100-256 samples. By keeping it short, we will eliminate reflected signals from further away, and not only the horn, such as microphone fitting and microhpone stand etc. Keeping it short, e.g. 128 will allow only the effect of the close radius of the horn. Ofcouse this has a trade off on the resolutio of the bass. Longer FFTs will produce excess amount of details and noise (mainly for the high frequencies) which are not physically related to the horn, but related to reflected sounds from other directions. Assuming a horn of 3cm radius: Reflections will have a delay of maximum 2 x 3 cm = 6 cm corresponding to 20 samples at 96kHz. Thus the effect of such horn may maximally extend the unit sample response by 20 samples.
Since Scilab, as far as I can find out, does not have any advanced contour polar plot features yet, Im using GIMP to convert to the plot in to polar coordinates. And finally setting up the charts in Inkscape.
The current challenges with the method relates to eliminating various artifacts and other sources of error in the plots, increasing the resolution for lower frequencies, and improving the phase plots, which currently do not look very convincing.


[…] the measurement method described in the previous post I have attempted to do a more systematic survey of the relation between the pressure equalizer […]
LikeLike
By: Pressure equalizer geometries and directionality « Recordings of nature's Blog on February 22, 2011
at 00:19
Hi, Isn’t this horn modification similar (albeit a different shape) to that applied by your dummy head/Jecklin Disc shown in your thunderstorm recording post? In that particular setup, the sound wave reflections and refractions are dependant upon the microphone setback distance from the disc’s front edge. I realise that with your acoustic horn approach, modification can take place in both horizontal and vertical planes, whereas the Jecklin Disc tends to work mainly in the horizontal plane.
Interesting post – will follow your further investigations!
LikeLike
By: Audio Field Recorder on May 14, 2011
at 22:04
Hi – thanks for the comment!
You are right, -to my understanding both the dummy head and the horn is part of the complete system modifying the frequency response dependent of the direction. In this case the dummy/jecklin disc should have a somehow limited effect on the frequencies due to the sound absorbing material. I actually made some measurements on that for the horizontal plane! https://recordingsofnature.wordpress.com/2010/03/21/quasi-binaural-setup/
So the distance to the dummy head may be used to control the lower frequencies, but it will also have some comb effect on the higher frequencies. I have not thought about this in my current setup, but could give an improvement!
The horn should only affect the higher frequencies, starting from maybe 3kHz, due to the smaller dimensions.
LikeLike
By: recordingsofnature on May 17, 2011
at 10:32